Staff Report #5
March 26, 2025
To All Commissioners
Re: Fare Adjustment Impacts
Recommendation
That the report be NOTED and FILED.
Background
At the June 26, 2019 meeting, the Commission confirmed the London Transit Fare and Media Strategy, which includes key objectives and principles as set out below:
Fare pricing and media strategy objectives:
- meet established transportation revenue requirements;
- maintain and build ridership, mitigating the traditional ridership loss associated with fare increases; and
- ensure that fare administration is both effective and efficient, balancing fare administration cost, fare validation requirements and customer convenience.
The fare pricing and media strategy reflects the following principles:
- customers want a service that provides direct travel that is convenient, reliable, safe, and affordable;
- customers are sensitive to savings;
- fare pricing and media options can influence service use;
- customers will pay for service quality;
- that it is beyond the mandate and expertise of London Transit to effectively resolve broader social and community issues related to income distribution; and
- that new or reduced concession fares, intend to resolve broader social and community issues relating to income distribution be considered if arrangements are made to subsidize London Transit for the associated loss of revenue – noting such subsidy is not a public transit subsidy but a subsidy supporting a defined group’s use of the service.
The confirmation of these strategies and principles set the framework for the approval of fare adjustments effective January 1, 2020 as well as those which took effect on January 1, 2024. The fare adjustment in 2024 resulted in an approximate 18% increase in all fares with the exception of the tuition pass programs which are governed under contract and include annual price escalations. The remainder of this report provides an overview of the impacts of the 2024 fare adjustments and commentary with respect to considerations that have been incorporated into the 2025 operating budget re-costing.
The following chart provides an overview of the revenue makeup by fare category over the last number of years. As the chart illustrates, with the exception of 2020, which was significantly impacted by the onset of the global pandemic, the percentage shares of each category have remained relatively consistent.
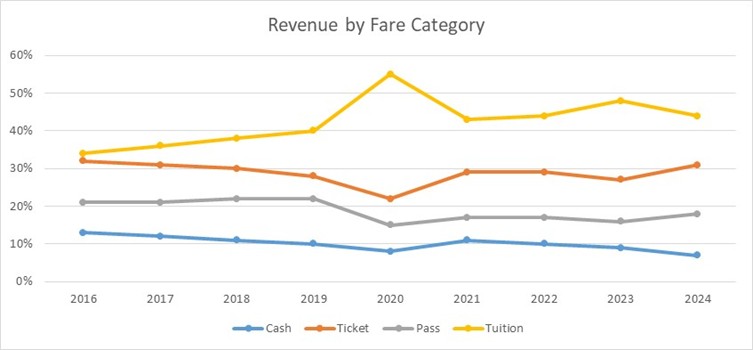
The significant increase in revenue share for the tuition pass program in 2020 is due to the continuation of the program and associated fees notwithstanding the cancellation of fares for an extended period while boarding took place via the back door of the bus (pandemic-related measures). For the purposes of comparison, 2020 should be excluded given the operating conditions for most of that year. Analysis in the remainder of this report with respect to the impacts of the January 1, 2024 fare adjustments will be compared against 2023 data.
When the fare adjustment was approved, it was anticipated to generate approximately $39.156 million in revenue, which was required to balance the 2024 budget. As set out in the table, the revenue target was slightly exceeded in 2024 primarily as the result of ridership exceeding budget. While at a summary level this appears to be positive, breaking down the revenue by category tells a different story. The following table provides a summary of the total transportation revenue by fare category for 2024 as compared to budget.
2024 Ridership and Revenue (millions) – Actual Versus Budget
| Ridership | Revenue | |||||
| Fare Category | Budget | Actual | Variance | Budget | Actual | Variance |
| Cash | 881.4 | 835.7 | (0.046) | $ 3.085 | $ 2.924 | $ (0.160) |
| Ticket | 5.109 | 5.034 | 0.015 | 12.661 | 12.701 | 0.041 |
| Monthly Pass | 2.919 | 2.886 | (0.032) | 7.100 | 7.029 | (0.071) |
| Tuition Pass | 10.547 | 10.737 | 0.190 | 17.067 | 17.453 | 0.386 |
| Total | 19.366 | 19.544 | 0.178 | $ 39.912 | $ 40.108 | $ 0.195 |
As the table indicates, the fare options excluding the tuition pass program were approximately $0.190 million short of revenue budget expectations (63,000 riders less than budget). The tuition pass revenue is entirely dependent upon enrollment numbers at participating institutions, which have increased significantly over the past several years with increased foreign student enrollments, however is now anticipated to decline given provincially established caps on foreign student enrollment going forward (see Staff Report #1 dated March 26, 2025). More specific analysis and commentary is set out in the remainder of the report, broken down by fare category.
Cash Fares
Cash ridership provides the highest revenue per ride, it is also the most costly to process, and as such, many transit agencies utilize pricing strategies to discourage the use of cash to pay for transit. Cash is also the method of payment for those who utilize transit infrequently, whether that be by choice or due to available financial resources. The table below provides the cash fares in place in 2023 and those which took effect on January 1, 2024.
| Cash Category | 2023 Fare | 2024 Fare | % Increase |
| Adult | $3.00 | $3.50 | 17% |
| Child (1) | $1.50 | $1.75 | 17% |
(1) Child cash fare represents the fare that would be in place in the event the City of London subsidy which provides for children 12 and under to ride free was no longer provided.
As indicated earlier in this report, given the pandemic-related impacts on ridership from 2020-2022, comparisons for the purposes of assessing impacts of the 2024 fare adjustment will be limited to 2023 data. The total cash ridership and related revenue for both 2023 and 2024 are set out in the table below.
| Adult Cash | 2023 | 2024 | % Variance |
| Ridership (millions) | 1.067 | 0.881 | (17)% |
| Revenue (millions) | $ 3.437 | $ 2.925 | (15)% |
A decline in cash ridership was anticipated as part of the 2024 fare adjustment given the change to a denomination that requires a minimum of four coins, which is perceived as cumbersome by the rider. In addition, cash fares represent the most expensive trip on transit, and given the significant inflationary pressures faced by society at large, a shift to a less costly fare category makes sense for most riders.
Ticket Fares
The ticket category generates the second highest average fare, and also generates the highest revenue percentage of all fare options available to the general public noting the tuition pass program generates the highest revenue overall but is limited to full time students at Western University and Fanshawe College. Based on the adult fare category, a transit rider would need to ride the bus 42 times in a calendar month (approximately 1.4 times per day) to make a monthly pass a more economic option than tickets. This category captures both riders who continue to utilize paper tickets as well as those that utilize the stored value option on smart cards, noting that in 2024, approximately 25% of ticket fares were paid via the stored value feature on the smart card.
The following table sets out the fares in place in 2023 as well as those that took effect January 1, 2024 as well as the percentage change in each category.
| Ticket Category | 2023 Fare | 2024 Fare | % Increase |
| Adult | 5 for $11.25 ($2.25/trip) | 5 for $13.25 ($2.65/trip) | 18% |
| Youth (age 13-17) | 5 for $9.00 ($1.80/trip) | 5 for $10.60 ($2.12/trip) | 18% |
| Senior(1) | 5 for $8.50 ($1.70/trip) | 5 for $10.00 ($2.00/trip) | 18% |
| Child(2) | 5 for $6.50 ($1.30/trip) | 5 for $7.65 ($1.53/trip) | 18% |
(1) Senior ticket fare represents the fare that is in place with the 25% subsidy provided by the City of London, should that subsidy be revoked, senior riders would pay the adult fare
(2) Child ticket fare represents the fare that would be in place in the event the City of London subsidy which provides for children 12 and under to ride free was no longer provided.
Ridership and associated revenue for each of the ticket categories is set out in the following table for both 2023 and 2024 including a percentage change column.
| Ticket Category | 2023 | 2024 | % Change |
| Ridership (millions) | |||
| Adult | 3.214 | 3.463 | 7.5 % |
| Youth | 0.724 | 0.693 | (4.3)% |
| Senior | 0.546 | 0.636 | 14.7 % |
| Child | 0.203 | 0.241 | 19.1 % |
| Total Ticket Ridership | 4.687 | 5.034 | 6.8 % |
| Total Ticket Revenue (millions) | $ 10.028 | $ 12.701 | 26.0 % |
As the table above illustrates, the incremental ticket revenue in 2024 over 2023 was approximately $2.7 million, which was the result of the increased fares as well as the shift away from cash and monthly passes to the ticket category.
Monthly Pass Fares
The monthly pass category represents approximately 18% of both total rides and total revenue. The table below sets out the adjustments applied to the various monthly pass options as part of the January 1, 2024 fare program.
| Pass Type | 2023 Price | 2024 Price | Increase |
| Citipass | $95 | $112 | 18% |
| Weekday Pass | $81 | $95 | 18% |
| Park and Ride | $70 | $83 | 18% |
| Youth(1) | $61 | $72 | 18% |
| Income Related(1) | $61 | $72 | 18% |
(1) Youth and Income Related pricing is based on the current City of London subsidies in place which provides for a 36% discount off of the Citipass. These pass types would not be part of the LTC fare structure in the event the City of London subsidy was no longer in place.
The following table provides the ridership breakdown by monthly pass category for both 2023 and 2024 including a percentage change column. As the table illustrates, on element of the 2024 fare program was the elimination of both the post-secondary monthly pass as well as the student summer pass as usage for both had declined significantly in the past number of years.
Total Ridership by Monthly Pass Category – 2023 to 2024
| Monthly Pass Category | 2023 | 2024 | % Change |
| Ridership (millions) | |||
| Citipass | 1.749 | 1.756 | 0.4 % |
| Weekday Pass | 0.200 | 0.252 | 26.0 % |
| Youth Pass | 0.344 | 0.398 | 15.7 % |
| Income Related Pass | 0.290 | 0.380 | 31.0 % |
| Post-Secondary | 0.031 | N/A | N/A |
| Student Summer | 0.030 | N/A | N/A |
| CNIB Pass | 0.072 | 0.072 | 0.0 % |
| Other | 0.030 | 0.027 | (10.0)% |
| Total Pass Ridership | 2.717 | 2.886 | 6.2 % |
| Total Pass Revenue (millions) | $ 5.817 | $ 7.029 | 20.8 % |
When assessing monthly pass usage, relying solely on ridership numbers can be misleading as passes are transferable and provide unlimited access to public transit services for the period they cover. When comparing year over year usage, the number of passes sold is a better number to indicate whether shifts have occurred away from monthly pass products, or between monthly pass options. The table below provides a summary of the average monthly pass sales for each category in both 2023 and 2024.
Average Monthly Pass Sales and Use by Type
| Average Monthly Pass Sales | Average Monthly Rides/Pass | Breakeven Rides | |||||
| Pass Type | 2023 | 2024 | Variance | 2023 | 2024 | Variance | 2023/24 |
| Citipass | 3,066 | 3,004 | (2.0)% | 47 | 48 | 2.1% | 42 |
| Weekday Pass | 486 | 610 | 25.5 % | 33 | 34 | 3.0% | 36 |
| Income-Related Pass | 493 | 629 | 27.6 % | 44 | 46 | 4.5% | 27 |
| Youth Pass | 884 | 978 | 10.6 % | 32 | 34 | 6.3% | 34 |
As this table sets out, there was an overall decline in average monthly Citipass (valid seven days a week) sales, offset by an increase in average monthly Weekday Pass sales (valid only Monday through Friday). The percent increase in the earlier table associated with Citipass ridership would indicate that those riders continuing to purchase the Citipass are using it more frequently than they were in 2023. The move to the Weekday Pass is likely in response to the fare adjustment, and riders choosing a more economical option for their travel needs who predominately rely on transit on weekdays.
The average monthly passes purchased over 2024 trended higher in all categories with the exception of the Citipass, which is consistent with expectations when across the board increases are applied as monthly passes are the most economic for those who make frequent use of public transit. The average rides per monthly pass also increased across all pass categories, however given monthly passes are transferable, it is not possible to determine whether it is one pass-holder using the pass more frequently, or pass holders making use of the transferability and sharing monthly passes to save money.
Tuition Pass Fares
The Commission currently holds three tuition-based pass program contracts with Fanshawe College, Western University undergrads and Western University Society of Graduate Students covering the period September 2024 through August 2027. The contracts include annual escalation clauses which dictate the annual price of the tuition pass for each academic year, (5% increase in year one and 1% plus annual change in Ontario Transportation Index capped at 5% per year for remaining years). The price of the annual tuition based pass for the 2023/24 (September 2023 through August 2024) academic year was $265.85 per full time student, and the price for the 2024/25 academic year was $279.14 (increase of 5%). While these contracts were not subject to the fare adjustment which took place January 1, 2024, the ridership and revenue from these programs represent a significant portion of the totals each year.
When negotiated, data relating to student usage and comparison to other fares were utilized as key inputs in effort to ensure:
- that tuition pass program participants in aggregate contribute a representative share to revenue recognizing the universal nature of the program;
- that administration of the program continues to be consistent;
- that the universal nature of the program continue to be protected; and
- increased costs associated with operating the transit service must be supported by a balance of increased fares and increased City of London investment.
Given the universal nature of the tuition pass programs, the annual ridership and revenue generated are directly tied to annual enrollments at participating institutions. As set out in Staff Report #1, dated March 26, 2025, the decline in enrollment occurring in 2025 has resulted in a budget shortfall. The following table sets out comparisons between 2023 and 2024 enrollment and ridership from the tuition pass program.
Total Tuition Pass Ridership 2023 to 2024
| Tuition Program Measure | 2023 | 2024 | % Change |
| Ridership (millions) | 10.138 | 10.735 | 5.9 % |
| Total Enrollment | 62,295 | 67,627 | 8.6 % |
| Average Annual Rides per Participant | 164 | 158 | (3.7)% |
Assessing these figures at the highest level would indicate that the overall population participating in this program used the service less frequently in 2024 as compared to 2023. When assessing the average annual rides per participant, it is important to recognize the universal nature of this program, noting that while some participants utilize the service frequently, others don’t use it at all.
Summary
As discussed earlier in this report, ridership and revenue from all fare programs available to the general public fell short of budget expectations in 2024. These results indicate that there may have been some migration away from public transit as the result of the January 1, 2024 fare adjustments. It also indicates that any further fare increases in the near term would very likely result in greater ridership decline, and should be avoided for as long possible.
As set out in Staff Report #1, dated March 26, 2025, the trends discussed in this report have already been incorporated into the recosted 2025 operating budgets. In addition, these trends will be utilized when updating the 2026 operating budgets.
Ridership and related revenue trends will continue to be monitored and reported on through the monthly financial updates, noting any significant variances would be subject of a separate report.
Recommended by:
Mike Gregor, Director of Finance
Concurred in by:
Kelly S. Paleczny, General Manager