Staff Report #6
April 27, 2022
To All Commissioners
Re: COVID-19 Ridership and Service Impacts
Recommendation
The report be NOTED and FILED.
Background
The pandemic declaration in March of 2020 and associated lockdown measures that have followed have continued to result in declines in transit ridership on both the conventional and specialized services. Each new wave of the pandemic has resulted in varying levels of public health measures, including lockdowns in some cases.
In addition to the impacts on ridership, London Transit has experienced numerous other impacts that have impacted the ability to deliver service and work program initiatives as planned. The remainder of the report discusses these impacts in greater detail.
Conventional Transit
Ridership
The organizational philosophy adopted at the onset of the pandemic with respect to service levels was to ensure that all areas of the city that were served by transit would continue to be served, albeit at lesser frequencies based on employee resource availability.
The graph below provides an overview of the ridership levels on the conventional service for 2021 and 2022 to date with comparative data for 2020, both as a percentage of what would normally be expected in each month noting the numbers are based on actual boardings as counted by the automatic passenger counters on buses. The bars are coloured to match the various stages of lockdown as noted below:
Green Prevent – no, very limited restrictions in place
Yellow Protect & Stage 3 under the current re-opening plan – very limited restrictions in place
Orange Restrict & Stage 2 under the current re-opening plan – limited restrictions in place
Red Control & Stage 1 under the current re-opening plan – numerous restrictions in place
Grey Lockdown – full lockdown restrictions in place
The colour blue in the graphic is used for January and February 2020 given the pandemic declaration had not occurred at that point in time. Bars that are striped indicate a change during the month from the base colour to the striped colour.
2020, 2021 and 2022 Conventional Transit Weekday Ridership as a Percentage of Normal
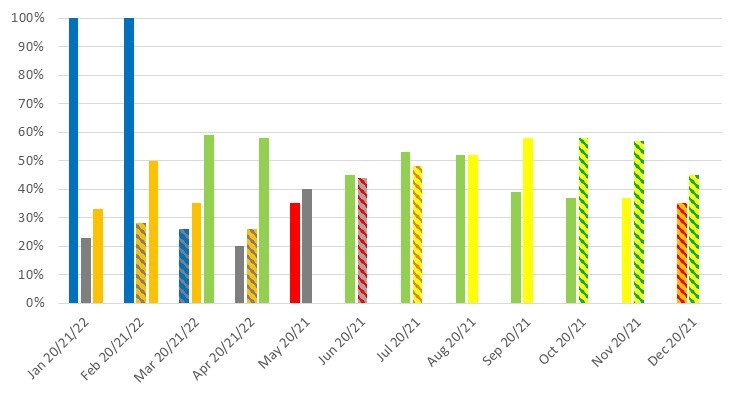
The conventional transit service has been operating at approximately 90% of normal service hours for each service period since September 2020. The above graph clearly depicts the impacts that the various stages of lockdown have on conventional transit service ridership. As indicated in the graph, weekday ridership for in March and April of 2022 has rebounded to approximately 60% of normal, which was anticipated given the return of more students to campus. Of interest, weekend ridership in March and April rose to between 70% and 80% of normal levels. With the elimination of virtually all Provincial restrictions on March 1, 2022, it is anticipated that ridership will continue to rebound over the coming months.
During the past several weeks, higher non-attendance rates associated with the latest pandemic wave have resulted in difficulties meeting service on several days. The resource issues have not been to the extent that have resulted in significant service disruptions, rather specific runs not going out which result in schedule and frequency gaps. In these cases the corporate social media accounts are utilized to advise customers of the potential for service issues and direct them to the real-time information for accurate next bus information.
Operator Resource Requirements
Work continues with respect to the onboarding of Operators in an effort to reach the required complement level to return to full service levels and implement the 2021 service improvements on May 1, 2022. While the April class which completes their training in early May was anticipated to bring the required complement of 436, there have been seven unanticipated retirements and/or resignations that have impacted progress. While this impact alone will not result in the need to defer the return to 100% service and begin implementation of the 2021 service improvements, when coupled with the ongoing high rates of non-attendance relating to the current pandemic wave, some adjustments may be required at the beginning of the sign-up period. Administration continues to monitor this closely and reassess on a daily basis with the intent that should any modifications from the plan be required, they will be undertaken in a manner that will result in the least impact for customers. Recruitment will continue throughout the summer in order to meet the complement requirements to implement the 2022 service improvements in September 2022.
Supply Chain Issues
Over the past number of months, supply chain issues have, to varying extents, impacted the ability to service and maintain the conventional fleet.
At time of report writing, there were six buses that are not available for service as the parts required are outstanding. With the decrease in number of buses down from last month (from 15 to six), significant progress has been made on the previously reported supply chain issues as administration has focused on procuring parts from alternative vendors, and some parts that were previously unavailable have begun to ship.
The availability of transmission fluid for buses continues to be a concern noting some progress has been made with respect to the identification of options moving forward. Administration continues to work with alternative suppliers of transmission fluid as well as the engine manufacturer in an effort to identify a solution that will not impact the engine warranty.
In late April, New Flyer advised that, due to a global computer chip shortage and the need for same for the Multiplex Module on board the bus, delivery of both the 2022 replacement and expansion buses is likely to be delayed. With respect to the replacement buses, administration has developed a strategy to keep the required number of buses in the fleet in order to maintain service levels. Depending on the extent of the delay, this could result in additional and unbudgeted costs to repair buses that are currently parked and scheduled for retirement. Administration is in regular contact with New Flyer in an effort to determine the extent of the delay noting work will not be undertaken on buses scheduled for retirement unless it is necessary to maintain service levels. Delay of the delivery of the five expansion buses will have a greater impact on service, as it will limit the ability to implement the 2022 service improvements in September should the buses not be available and ready for service. Under normal circumstances, buses scheduled to be retired could be kept in service for a few extra months to compensate for the delay in expansion buses; however, given the delay in replacement bus delivery coupled with the costs associated with repairing buses that will be retired in the very short term, this approach may not be feasible for 2022. This issue will be closely monitored in the coming months and updates will be provided.
Specialized Transit
Ridership
The graph below provides an overview of the ridership levels on the specialized service for 2021 and 2022 to date, with comparative data for 2020 as a percentage of what would normally be expected in each month. Consistent with the earlier graph, the colours in the various bars are reflective of the stages of lockdown that were in place at the time.
2020, 2021 and 2022 Specialized Transit Ridership as a Percent of Normal
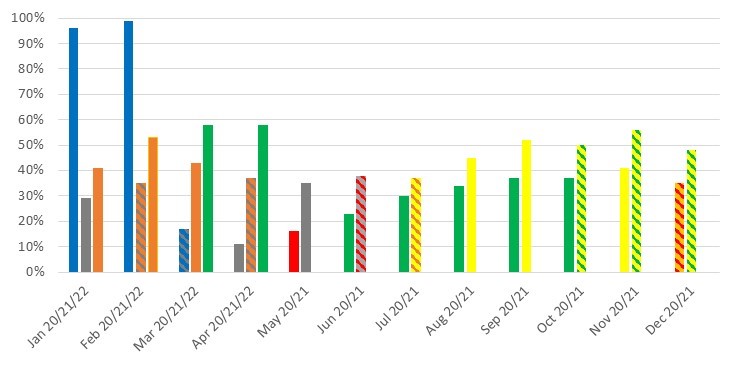
As the graph indicates, ridership levels to date for March and April 2022 surpassed the previous pandemic-period high from November 2021. Administration will continue to monitor trip demand by time of day and day of week, and gradually increase service hours to meet demand.
Service
As indicated above, administration is continuing to monitor service demand and will work with the contracted service provider to increase service levels as demand warrants. The only issue with respect to making these adjustments relates to the service provider’s ability to secure drivers to meet the increased service requirements.
Recommended by:
Katie Burns, Director of Planning
Mike Gregor, Director of Finance
Craig Morneau, Director of Fleet & Facilities
Joanne Galloway, Director of Human Resources
Concurred in by:
Kelly S. Paleczny, General Manager